
 (Source: Business Standard)
It was the best of times, it is the worst of times, it was the age of wisdom, it is the age of foolishness, it was the epoch of belief, it is the epoch of incredulity, it was the season of Light, it is the season of Darkness, it was the spring of hope, it is the winter of despair, we had everything before us, we have nothing before us, we were all going direct to Heaven, we are all going direct the other way – in short, the period is so far unlike the previous period, that some of its noisiest authorities insist on its being received, for good or for evil, in the superlative degree of comparison only.
(with due apologies to Mr Dickens).
Much is being made of the recasting of GDP data. Conveniently, UPA-1 and UPA-2 period growth rates have come out trending lower than earlier published figures. This puts an end to the claim of double digit growth during the UPA era.
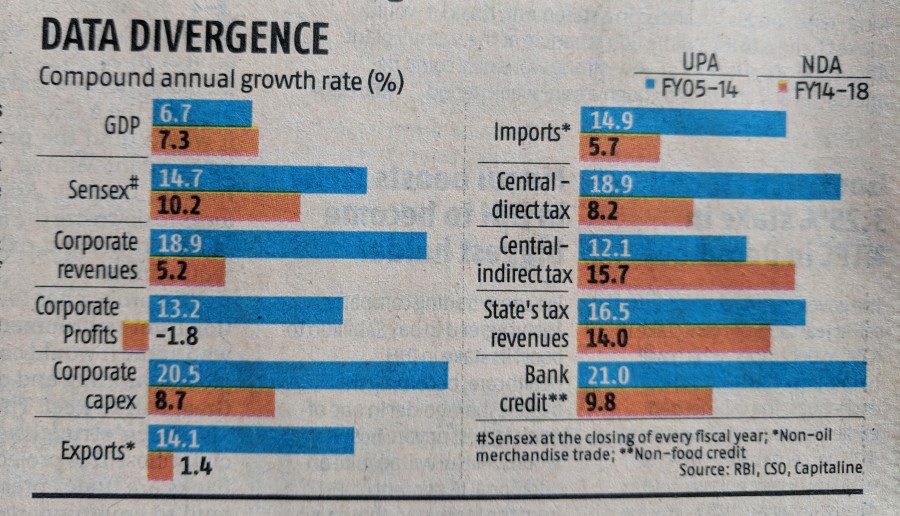
Without getting into the statistical jugglery that has facilitated this downward revision, lets focus on real life indicators that are less easy to juggle (read, fudge/obfuscate/fake/manipulate/doctor/massage), in addition to GDP growth. Growth in:
- Sensex (presumably growth and growth prospects will eventually reflect in stock market sentiment, and thus performance)
- Corporate Revenues (if there is growth, companies will sell more, na?)
- Corporate Profits (if companies are selling more, they will earn more, it follows)
- Corporate Capex (if they are selling and earning more and they believe growth is secular, companies will invest more),
- Exports (non-oil) (how competitive the country is globally),
- Imports (non-oil) (the resources a growing country needs in terms of raw materials, equipment, etc)
- Central Direct Tax (growth results in earnings, earnings results in taxes),
- Central Indirect Tax (consumption and investment driven growth leads to higher indirect taxes)
- States’ Tax Revenues (what is good for the consumer/investor is good for the local government)
- Bank Credit (a growing economy needs bank credit)
This is a universally acceptable list of real world indicators, perhaps even for blind as bats and bat shit crazy Modi Bhakts. So let us begin.

A 4.5 percentage point difference in returns over a 5 year period means that for every Rs100 that you started with, you were better off with the UPA (Rs198.53) by 22.2% compared to the NDA (Rs162.52). Multiply this difference over the entire market capitalisation of the Indian equity markets (US$ 2.18 tn) and you have a HUGE hole thanks to lower performance.

Over the long term (and assuming things are going well), one would expect corporate revenues to grow at the rate of nominal GDP growth (i.e. real GDP growth rate + inflation). As a thumb-rule, 10% is considered to be a good yardstick given around 6-7% real GDP growth and 3-4% long-term WPI. The 10 year UPA era saw growth that was nearly TWICE that thump-rule while the Modi era has seen growth of half the thumb-rule. If growth rates are indeed higher post UPA then it isn’t clear who is growing.

Revenue is vanity; profit is sanity. Moving beyond topline growth, corporate profits reflect the policy environment, growth prospects, and sentiment even more strongly. Here, the difference is even more stark with 13.2% profit CAGR in 10 years of UPA compared to a -1.8% CAGR (basically, stagnation) in the 5 year Modi era. This is thanks to misadventures like DeMo, a hurried GST, currency volatility, policy ambiguity, inadequate attention to bank recap, belated realisation of the extent of the bank NPA problem, and a host of other governance failures. Absence of profits mutes employment generation, capital investment, R&D spend, CSR, etc.

As expected, the muted growth is resulting in lower corporate capex, forcing the govt to step in with expanded public sector capex. This exacerbates the deficit situation, resulting in higher inflation, a depressed INR, and a classic chicken and egg situation. More so when the public sector capex is directed at wasteful assets (such as statues).

Non-oil Exports growth rate that is a 10th of the UPA era growth rate! Seriously! A 10th!! Despite all the valuable (expensive!?) relationship building through foreign trips! Make in India, Start Up India, Get Up India, Sit Down India, Go to Sleep India! The consumption lever isn’t working, the investment lever isn’t working, and the exports lever clearly isn’t. Perhaps Modi can invent a 4th GDP growth lever!

The story with imports is a similar one. The modest 5.7% growth that is seen here is also largely thanks to consumption oriented imports. This has exacerbated the INR’s fall and worsened the BoP/CAD situation, if nothing else. Cheap and easy consumer credit (apart from data) is the opiate of the masses, clearly.

Direct tax growth is a reflection of growth in personal income and corporate taxes. The difference in growth is stark. Even more so when you consider that ITD scrutiny has increased post DeMo, compliance has gone up, and there are more people filing ITRs. Despite this, there is a 10.7 percentage point difference in direct tax collection growth rates!
Indirect tax growth is the only area where the NDA area outshines the UPA era. No surprises here. a) GST has led to greater compliance; b) excise duty on fuel has been increased to a level where it is burdening the economy, thus increasing collections. Not much for the Modi govt to take credit for here.

State tax revenue growth is lower in the last 5 years than in the 10 before that, though not by much. Given that big ticket items like real estate, fuel, and liquor have been left out of GST, this isn’t surprising. In any case, the stagnation of state revenues also points towards lower growth rates, which is the moot point.

Finally, bank credit. All the moderation in revenues, stagnation/degrowth in profits, lower sentiment, volatility, indebtedness, etc. is reflected in the reluctance to borrow to expand. 9.8% is below nominal GDP growth and is much less than half of the UPA era credit growth rates. Modi/Jaitley in their ‘Heads I Win; Tails You Lose‘ approach will claim that there was profligate lending during the UPA era, which led to the NPA problem. Simultaneously, they will pressure/bully the RBI to relax the PCA restrictions on banks – which have been put in place to control the problems on hand – so as to push credit (push credit on to who? Who wants to borrow?! And for what?!).
Headline GDP and Ease of Doing Business Rankings – the two pet obsessions of the Modi/Jaitley combine – have only led to a reverse goal seek exercise. And this may be what this 5yr period has been all about. Just that much, nothing else.
Ok fine, a couple of statues too.

Well considering your qualification, I would have expected a much better analysis from you rather than taking just an average of so many metrics over UPA-NDA years. Your analysis conveniently forgets in which state UPA took the economy from NDA hands in 2004 and how UPA wrecked it during their 10 yr rule only to handover back to NDA in 2014. Economy stats are based on contexts. Just look how fiscal deficit, current account deficit, inflation, INR stability, world GDP growth held during NDA and UPA. Perhaps then, you will get a real picture.
LikeLike
My qualifications have nothing to do with the analysis – the numbers speak for themselves. If one were to go by your argument then everything good that happened during the 10 long years were the result of NDA 1’s policy measures and that the wrecking ball that UPA took through the economy between 2004 and 2014 somehow did no damage during the 10yr period and the effects showed up only post 2014. Ok, can’t argue with that! 😀
UPA1 ended its days in the throes of the crippling global financial crisis that thwarted growth worldwide.
UPA1 saw the INR strengthen to sub-40 levels, and yet export growth was much higher.
Both UPA tenures saw oil prices spike up to record levels (most recently towards the end of UPA2 to above $110/bbl) and yet pump prices stayed low without wrecking govt finances
On world GDP growth, NDA2 years have been witness to slowing Indian growth rates (despite all the obfuscation) in an era when global growth rates have been trending above average.
Definition of “real picture” isn’t a subjective one – despite what folks may want you to think.
LikeLike